Linux VPS
What to Monitor on a Linux VPS Before It Fails
Choose useful Linux VPS signals, connect alerts to an action and distinguish a guest problem from something the hosting provider must investigate.
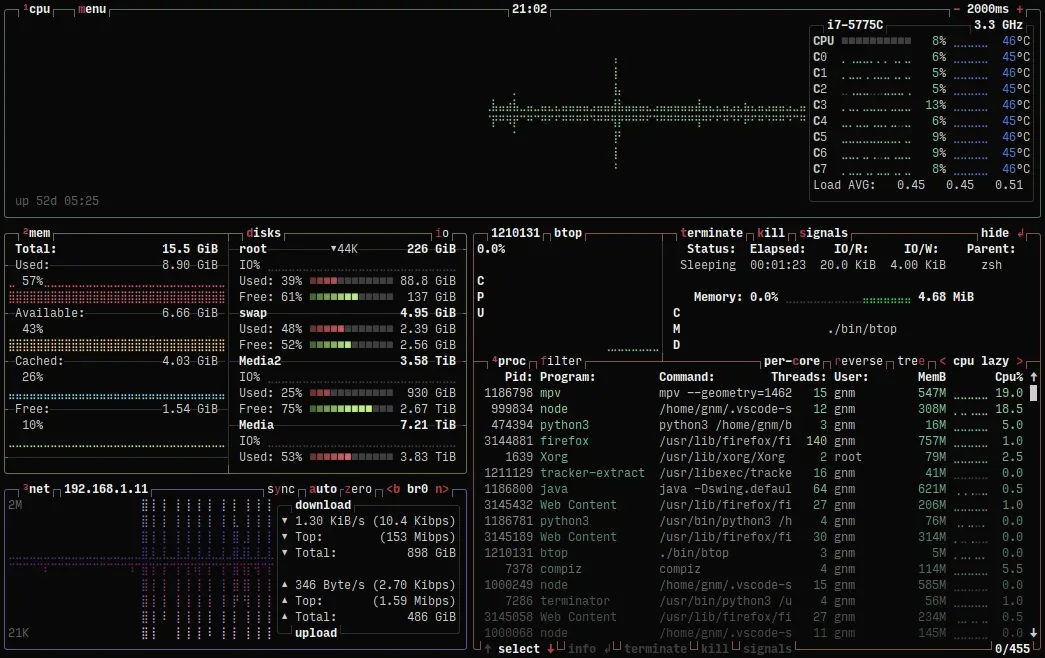
A dashboard full of graphs can still miss the failure customers care about. A web process may be running while every request times out. A backup job may finish without producing a recoverable archive. Start monitoring with the service outcome, then add resource signals that help explain a change.
For a small Linux VPS, useful monitoring answers four questions: can a client use the application, is the machine approaching a resource limit, are scheduled protection tasks succeeding, and who will respond? The correct thresholds depend on workload and recovery time. Copying another server's alarm values can produce either constant noise or a warning that arrives too late.
Check from outside the server
An external check can see problems that the server cannot report about itself. Monitor an appropriate public endpoint from a separate system. For HTTPS, check the expected hostname and certificate validity as well as connection success. A redirect to the wrong site should not count as a healthy response.
Choose a request that represents normal service without changing production data. For a private application, an authenticated synthetic check needs a restricted test account and careful secret handling. Avoid a check that creates orders, sends emails or fills a database every minute. Keep the monitor independent of the machine it is watching.
Watch storage in more than one way
Track free filesystem capacity and inode availability. A large number of small files can exhaust inodes while byte capacity remains. Separate the root filesystem, application data and backup destination rather than displaying one combined free-space figure. Record growth so the alert arrives early enough to expand or clean up safely.
Storage latency is a different question from storage capacity. Short read-only observations can help relate slow requests to I/O waits, but they need context. The iostat manual explains its counters; a single utilization percentage is not a universal storage health score. Do not run production write benchmarks as an automatic response to a latency alert.
On a dedicated server, supported drive-health reports can add hardware evidence. Inside a VPS, virtual disks often do not expose the physical hardware. Ask support to correlate the guest incident with host storage metrics rather than assuming the guest can see every layer.
Interpret memory alongside workload
Linux uses memory for caches, so low free RAM is not enough to prove exhaustion. The free manual distinguishes the available estimate from the free column. Combine memory trends with swap activity, service limits and kernel events.
Watch the application too. A Java heap limit, database buffer allocation or container ceiling can constrain a service before the entire VPS runs out of memory. Conversely, a guest graph cannot prove how much physical RAM remains on the hypervisor. When unrelated machines fail together, provider-side correlation becomes important.
Monitor the protection tasks
A backup alert should identify the newest successful backup, its age and whether it reached the independent destination. Include failures and unexpectedly long runs. A file existing under a familiar name is weak evidence if it might be yesterday's incomplete result.
Plan periodic restoration tests separately from routine job completion. Check permissions and encryption for sensitive archives. The Linux backup verification guide helps establish what a checksum can and cannot prove. Certificate renewal and scheduled reports deserve similar result checks, not just a record that the scheduler invoked them.
An illustrative alert policy
Consider a small community site whose upload directory grows steadily. This is an illustrative scenario, not a measured customer deployment. The owner sets a capacity warning with enough time to review growth and arrange expansion. A separate urgent alert covers application failure from outside the VPS.
The warning includes the affected filesystem, current trend and a link to the capacity procedure. It does not automatically delete old files. The urgent alert includes the failing URL and recent check history. The person responding can distinguish a planned maintenance window from an unexpected outage without searching several inboxes.
Give every alert a next step
Route alerts to a destination someone checks, group repeated failures and send a recovery notice when service returns. Document who handles guest configuration and when hosting support should investigate the underlying infrastructure. Include UTC timestamps, service identity and a bounded sample of evidence; exclude tokens and passwords.
Review alerts after incidents and routine maintenance. Remove duplicates, adjust noisy conditions with evidence and retain warnings that lead to a useful action. Our systemd investigation guide and disk-space guide provide practical first responses when those alerts arrive.